Tightness
harder (descriptive)
Tight ahead · tight now
Your plan sets the demand. Market Intelligence shows the market: wages, hiring trends and supply by occupation and US metro, from official public statistics.
~400 metros800+ occupations10-year wage forecasts
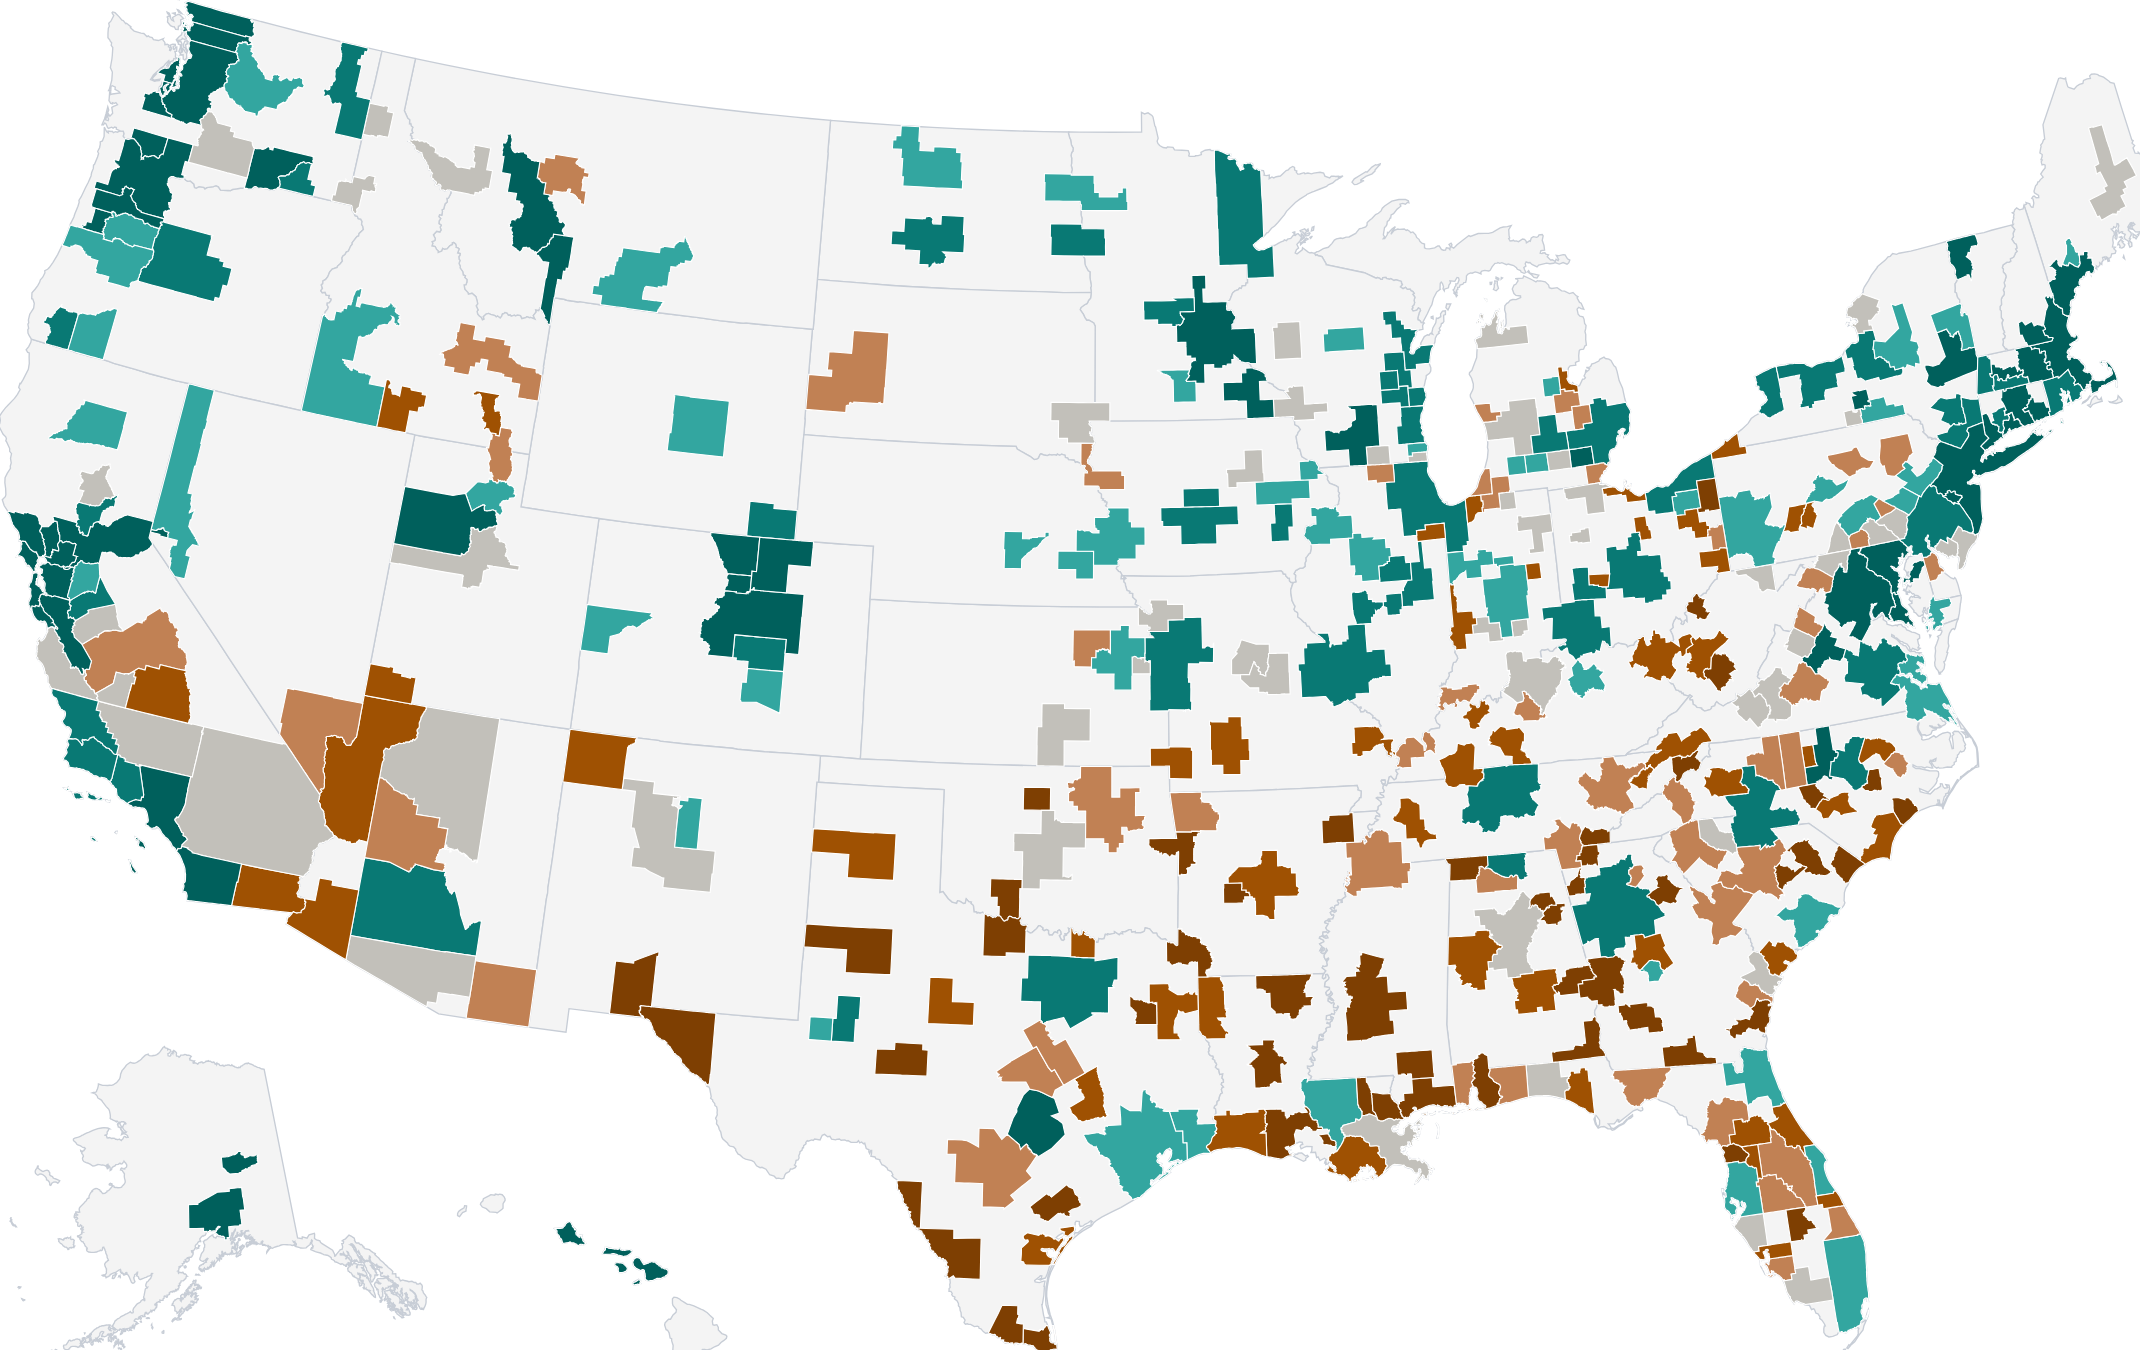
See what a role is going for in a metro, how hiring is trending, and whether supply keeps up.
75k+ job titles · 5+ years of hiring history
harder (descriptive)
Tight ahead · tight now
$138,515
Vs national $140,436
$174,259
Base pay
−1.3%
Year on year hires, 2025 vs 2024
at risk
461 net new supply vs 2,200 openings a year
Wage distribution · annual base pay
National median $140,436
Why "harder"? 3 of 3 descriptive signals
Survey wages brought to today, then forecast ten years out, with a range that widens with time.
Median annual base pay
| Year | Median | Range |
|---|---|---|
| 2021 · Survey | $103,410 | |
| 2022 · Survey | $109,650 | |
| 2023 · Survey | $131,320 | |
| 2024 · Survey | $133,070 | |
| 2025 · Survey | $134,120 | |
| 2026 · Forecast | $138,702 | $136,421–$140,982 |
| 2027 · Forecast | $143,361 | $138,685–$148,114 |
| 2028 · Forecast | $147,852 | $140,672–$155,272 |
| 2029 · Forecast | $152,327 | $142,539–$162,612 |
| 2030 · Forecast | $156,864 | $144,360–$170,219 |
| 2031 · Forecast | $161,501 | $144,796–$179,782 |
| 2032 · Forecast | $166,260 | $144,758–$190,443 |
| 2033 · Forecast | $171,153 | $144,255–$202,342 |
| 2034 · Forecast | $176,187 | $143,291–$215,632 |
| 2035 · Forecast | $181,367 | $141,877–$230,487 |
| Today · 2026 Q2 | $138,515 |
Sourced occupational wage statistics: what the role paid, by percentile, in a given metro.
Normalized to the present through established wage-cost indexes.
Long-term forecasts anchored to published economic outlooks, and tested against past years for accuracy.
A forecast range, calibrated to account for uncertainty.
μFORE models long-term supply and job openings for each role and metro.
Three-stage supply and openings model · 10-year horizon
New talent entering the role, modeled from graduates for degree roles and from the local workforce for the rest.
Retirements, projected from the age profile of each role’s workforce.
Regional employment projections, downscaled to each metro and adjusted for local growth.
Choose a few metros and rank them by pay, tightness and supply. Or see the role across the whole country.
Seattle–Tacoma–Bellevue, WA
The only one of the 5 rated easier
San Francisco–Oakland–Fremont, CA
$226,868 at the 75th percentile
Austin–Round Rock–San Marcos, TX
Still 1,739 a year short
| # | Metro | Tightness | Median wage | Pay range (P10–P90 ($88,735–$282,358)) | 75th pct. | Supply | Openings |
|---|---|---|---|---|---|---|---|
| 1 | San Francisco–Oakland–Fremont, CA | harder | $192,756 | $226,868 | at risk | 5,011 | |
| 2 | Seattle–Tacoma–Bellevue, WA | easier | $172,761 | $218,802 | insufficient data | n/a | |
| 3 | New York–Newark–Jersey City, NY-NJ | harder | $172,296 | $212,719 | at risk | 6,927 | |
| 4 | Austin–Round Rock–San Marcos, TX | harder | $138,515 | $174,259 | at risk | 2,200 | |
| 5 | Dallas–Fort Worth–Arlington, TX | harder | $137,657 | $169,477 | at risk | 4,586 |
Read key market figures, like median and 75th-percentile base pay, to help you set assumptions for a role or a compensation plan.
Software Developers (15-1252) — Austin–Round Rock–San Marcos, TX
Department: EngineeringLevel: IC 4-6Region: North America